Free for CS teams

Stop scrambling before every QBR

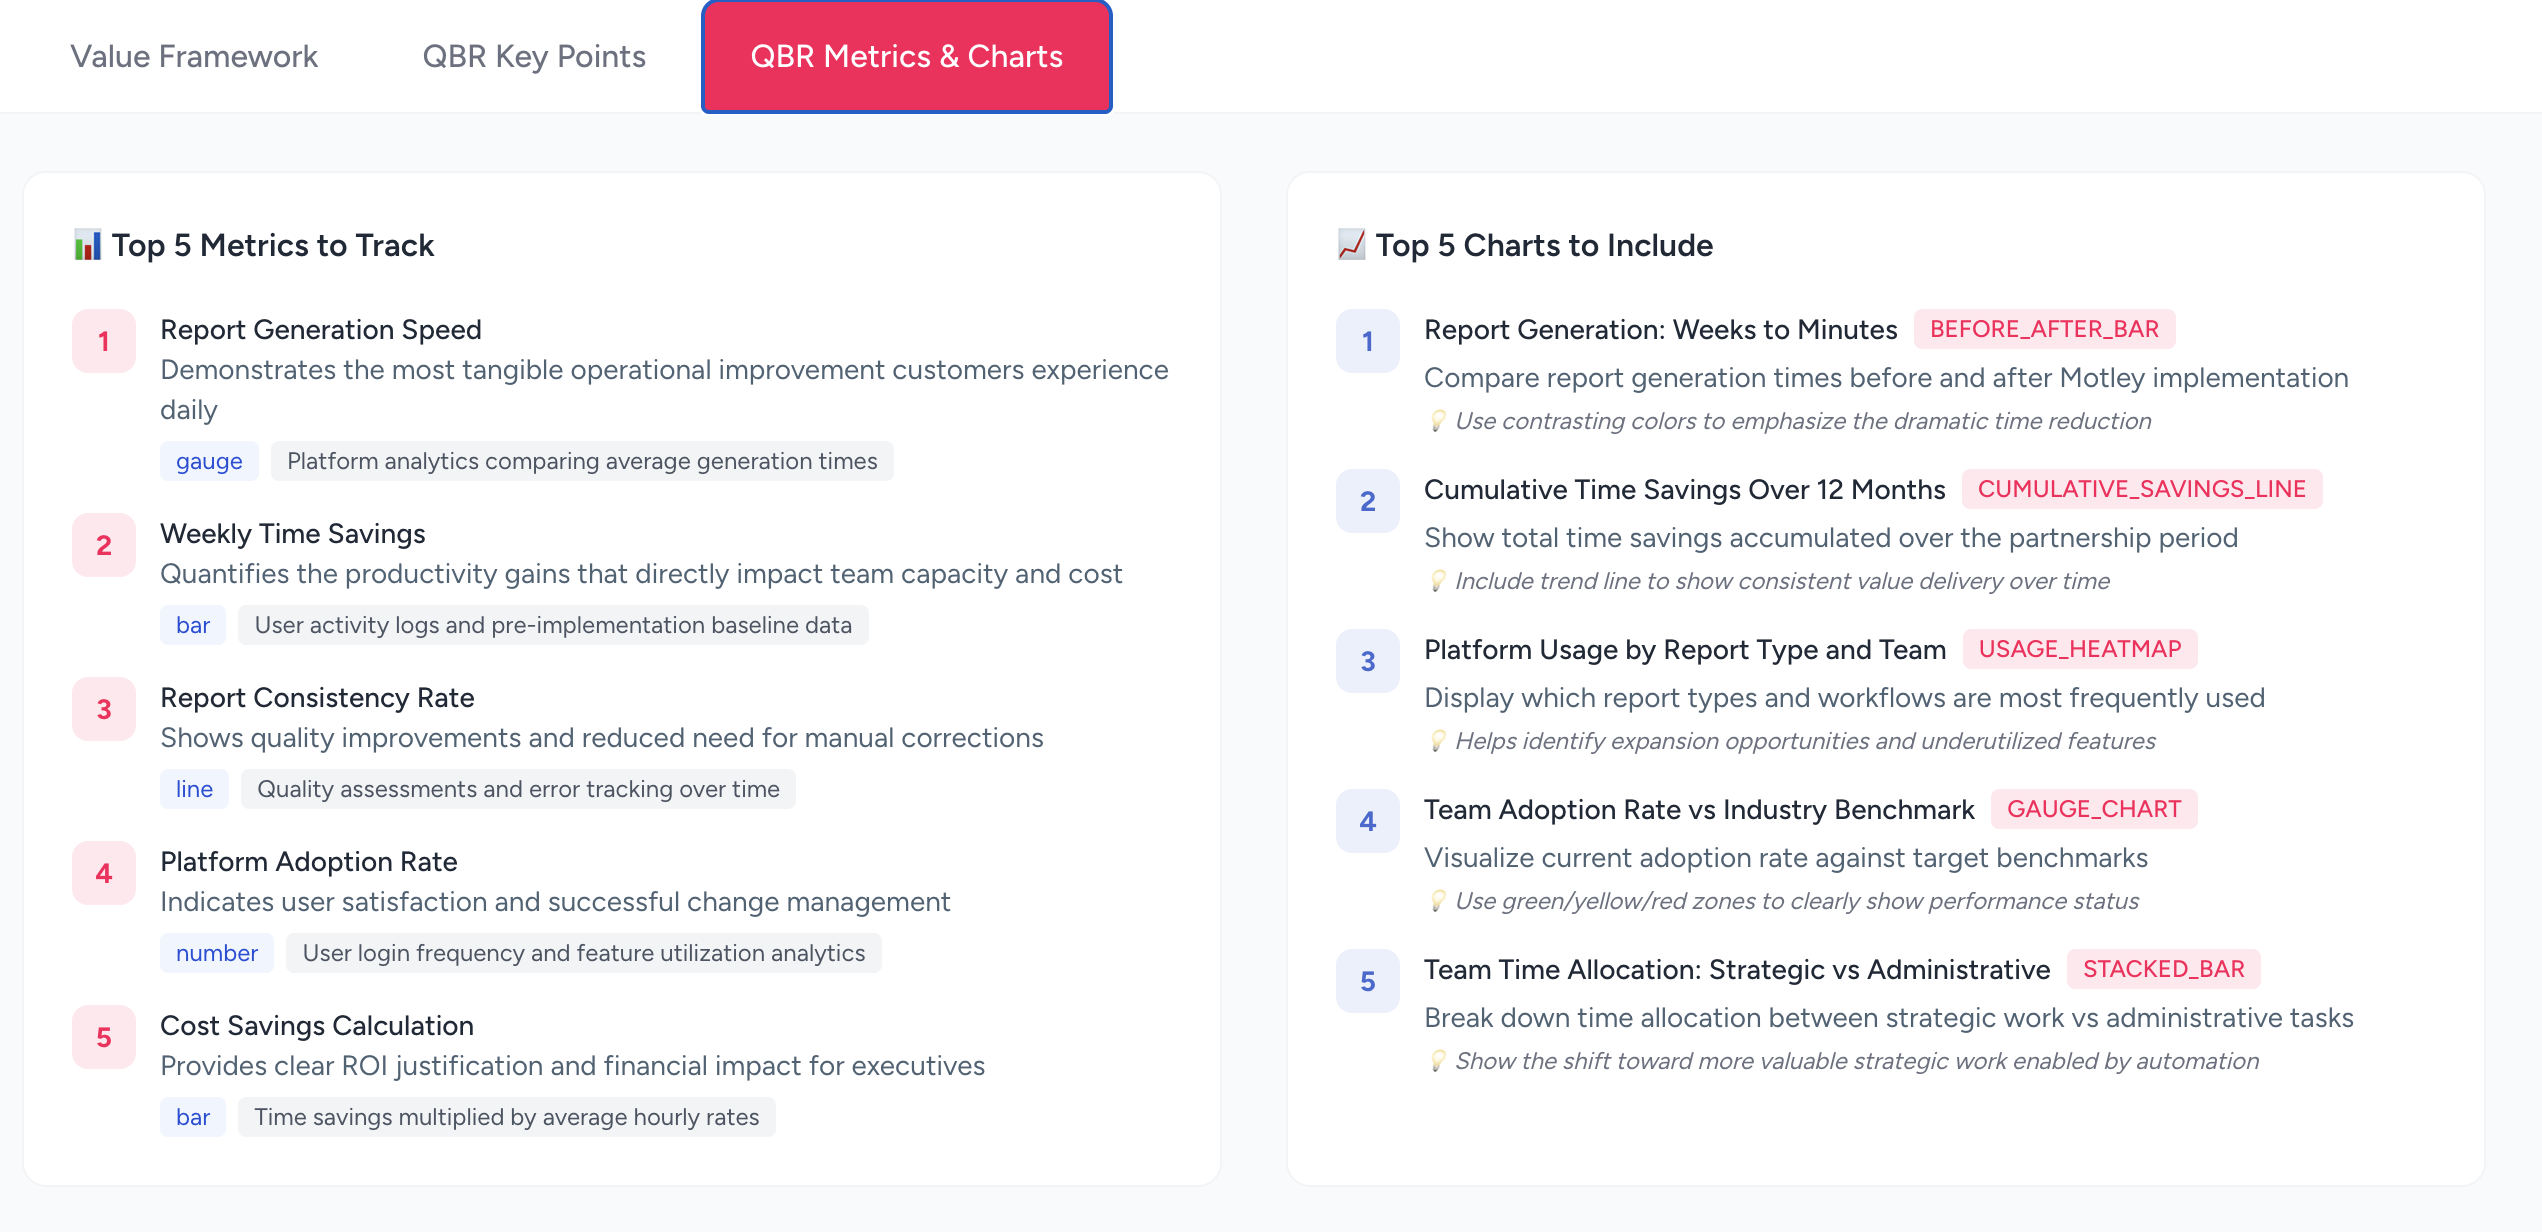
Get a ready-to-use value framework, QBR key points checklist, and suggested metrics & charts for your product, generated in 90 seconds from your website.

Know exactly which key points to hit in your QBR
Get the right metrics and charts to back up the story
Connect features to business outcomes customers care about
Generate Your Framework

Takes 90 seconds

QBR Metrics & Charts - Top 5 Metrics and Charts to Include

90s

Avg. generation time

Sound familiar?

😰

"I spend hours prepping for QBRs but still feel underprepared"

🤷

"I struggle to articulate our product's value beyond features"

📊

"I never know which metrics or charts to put in my QBR deck"

How it works

From website URL to a complete QBR toolkit in three simple steps

1

Enter your company website

Drop in your company's website. We'll analyze your messaging, value props, and product positioning.

2

AI extracts value drivers

Our AI identifies the problems you solve, success metrics, and customer outcomes from your content.

3

Get your QBR toolkit

Receive a value framework, QBR key points checklist, and suggested metrics & charts. Ready to use with your customers.

Try it now

Generate your value framework in under a minute

We'll analyze your website to build your value framework

Everything you need to run a great QBR

Three deliverables that transform how you prepare for customer reviews

Value Framework

A structured view of the problems your product solves, value drivers, and success metrics. Organized by the 4 pillars of value.

  • Problems you solve
  • Value categories & drivers
  • Suggested success metrics

QBR Key Points

5 suggested key points to cover in your next QBR, with talking points and discovery questions you can check off as you go.

  • Interactive checklist format
  • Talking points & questions per topic
  • Grounded in your value framework

QBR Metrics & Charts

10 data-driven suggestions — 5 metrics to track and 5 charts to include — to make your QBR compelling and measurable.

  • Top 5 metrics with data sources
  • Top 5 chart recommendations
  • Visualization tips & best practices

Powered by Motley

Automate your entire reporting workflow

Manual reporting costs business teams 2.4 billion hours a year. Motley turns raw data into polished, presentation-ready reports in minutes, not weeks.

Connect your data

CSVs, BI tools, databases, CRMs. Pull from any source with native charts and queries.

Generate reports

Live, up-to-date decks from master templates. Dynamic slides based on your data.

Personalize at scale

Unlimited variations for different audiences. One template, every customer.

No more copy and paste
No more data wrangling
No more blank pages

or visit motley.ai